2.7 Download
All downloadable data provides users with a centralized access portal aimed at facilitating their access to research resources. We have integrated the following comprehensive datasets: (i) scATAC-seq data; (ii) Fine-mapping results; (iii) The trait–relevant score (TRS) of each single-cell generated by g-chromVAR and SCAVENGE methods; (iv) Results of gene and TF related analysis; (v) Gene regulation annotation data.
2.7.1 Download TRS data for each sample
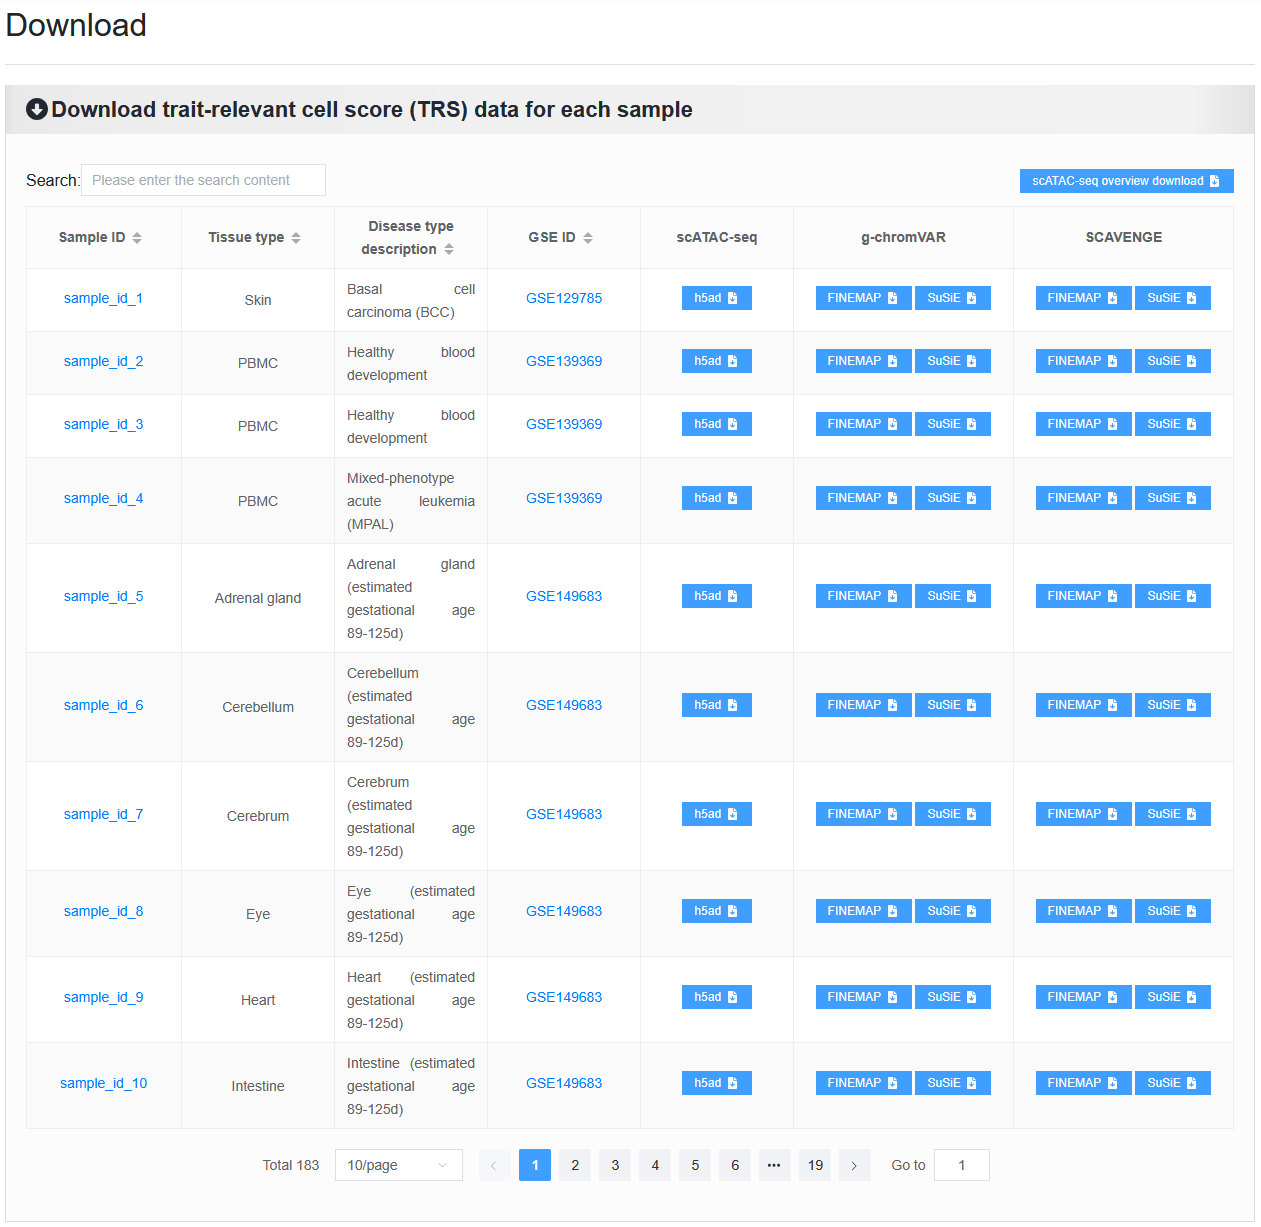
Below are the detailed download instructions.
2.7.1.1 Overview of scATAC-seq data: txt file
# |
Column name |
Description |
|---|---|---|
1 |
f_sample_id |
The unique identifier of the single-cell sample, used for database operations. |
2 |
f_gse_id |
GSE ID |
3 |
f_genome |
The reference genome of the single-cell sample. |
4 |
f_geo_id |
GEO ID |
5 |
f_label |
The unique identifier for the single-cell sample, used as the file name during data processing. |
6 |
f_pmid |
PMID |
7 |
f_species |
The species information of the single-cell sample. All data belongs to humans. |
8 |
f_tissue_type |
The tissue type of the single-cell sample. |
9 |
f_sequencing_type |
The sequencing type of the single-cell sample. |
10 |
f_health_type |
The health type of the single-cell sample. |
11 |
f_health_type_description |
Detailed information on the health type of the single-cell sample. |
12 |
f_description |
Detailed information on the content of the single-cell sample. |
13 |
f_source |
The source name of the single-cell sample. |
14 |
f_source_url |
The link to the source of the single-cell sample. |
15 |
f_counts_layer |
The layer name of the counts matrix stored in the Seurat object of the single-cell sample. |
16 |
f_sample_exist |
The single-cell sample contains multiple sample information. |
17 |
f_cell_count |
The number of cells in the single-cell sample. |
18 |
f_cell_type_count |
The number of cell types in the single-cell sample. |
19 |
f_index |
The unique index identifier of the single-cell sample has no meaning and is only used for sorting. |
20 |
f_time |
An indicator variable for whether this single-cell sample contains cell annotation information for age/day/time. 1 indicates presence, 0 indicates absence. |
21 |
f_sex |
An indicator variable for whether this single-cell sample contains cell annotation information for sex. 1 indicates presence, 0 indicates absence. |
22 |
f_drug |
An indicator variable for whether this single-cell sample contains cell annotation information for drug resistance. 1 indicates presence, 0 indicates absence. |
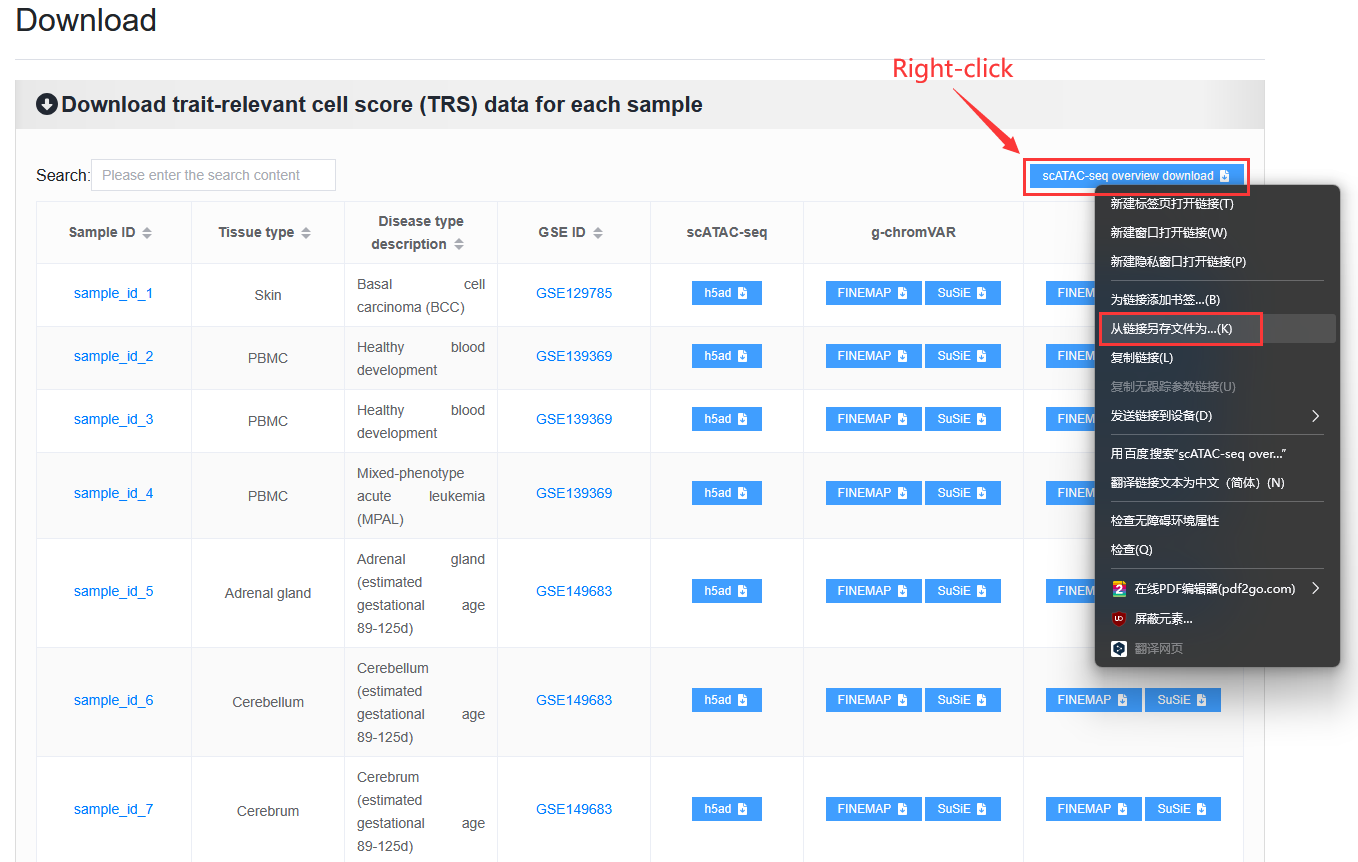
Note
When downloading files, some browsers will directly open the txt file and need to save the file by right-click.
2.7.1.2 scATAC-seq data: H5AD file
Read the information of sample_id_1.
 1>>> data
 2AnnData object with n_obs × n_vars = 36721 × 414680
 3    obs: 'n_fragment', 'frac_dup', 'frac_mito', 'tsse', 'doublet_probability', 'doublet_score', 'barcode', 'n_genes', 'n_counts', 'cell_type', 'UMAP1', 'UMAP2', 'barcodes'
 4    var: 'count', 'selected', 'chr', 'start', 'end', 'n_cells'
 5    uns: 'doublet_rate', 'macs3', 'params', 'project_name', 'project_version', 'reference_sequences', 'scrublet_sim_doublet_score', 'step'
 6    obsm: 'fragment_paired'
 7>>>
 8>>>
 9>>> data.var
10                            count  selected   chr      start        end  n_cells
11index
12chr1:237500-238000          316.0      True  chr1     237500     238000      296
13chr1:238000-238500          316.0      True  chr1     238000     238500      296
14chr1:540500-541000          222.0      True  chr1     540500     541000      217
15chr1:541000-541500          222.0      True  chr1     541000     541500      217
16chr1:713500-714000        10773.0      True  chr1     713500     714000    10145
17...                           ...       ...   ...        ...        ...      ...
18chrX:155232500-155233000    246.0      True  chrX  155232500  155233000      225
19chrX:155233500-155234000    200.0      True  chrX  155233500  155234000      186
20chrX:155234000-155234500    200.0      True  chrX  155234000  155234500      186
21chrX:155260000-155260500    603.0      True  chrX  155260000  155260500      563
22chrX:155260500-155261000    603.0      True  chrX  155260500  155261000      563
23
24[414680 rows x 6 columns]
25>>>
26>>>
27>>> data.obs
28                    n_fragment  frac_dup  frac_mito       tsse  doublet_probability  doublet_score             barcode  n_genes  n_counts    cell_type      UMAP1      UMAP2            barcodes
29index
30AAACGAAAGAACGACC-1       24764  0.613793        0.0  14.751286             0.102154       0.095522  AAACGAAAGAACGACC-1    46094     49528      Tumor 4  10.567199  -4.781785  AAACGAAAGAACGACC-1
31AAACGAAAGAATACTG-1        2506  0.389822        0.0  14.333112             0.185441       0.001557  AAACGAAAGAATACTG-1     4809      5012      Myeloid   1.443223  13.324852  AAACGAAAGAATACTG-1
32AAACGAAAGACACGGT-1        4923  0.478827        0.0  23.241852             0.124562       0.040230  AAACGAAAGACACGGT-1     9438      9846         Treg  -1.004199  -7.261578  AAACGAAAGACACGGT-1
33AAACGAAAGACCCTAT-1        3674  0.443755        0.0  21.428571             0.172410       0.007480  AAACGAAAGACCCTAT-1     7059      7348            B  -5.697628  13.187097  AAACGAAAGACCCTAT-1
34AAACGAAAGAGGTACC-1        7178  0.488674        0.0  20.920746             0.152831       0.018101  AAACGAAAGAGGTACC-1    13666     14356      CD8 TEx  -5.956334  -3.010488  AAACGAAAGAGGTACC-1
35...                        ...       ...        ...        ...                  ...            ...                 ...      ...       ...          ...        ...        ...                 ...
36TTTGTGTTCGAGGCTC-1        4853  0.432597        0.0  17.623604             0.179749       0.004054  TTTGTGTTCGAGGCTC-1     9306      9706         Treg   1.477226  -8.637981  TTTGTGTTCGAGGCTC-1
37TTTGTGTTCGGGTCCA-1        5016  0.492256        0.0  24.892704             0.174884       0.006297  TTTGTGTTCGGGTCCA-1     9551     10032         Treg   2.348910  -6.036977  TTTGTGTTCGGGTCCA-1
38TTTGTGTTCGTCCCAT-1       12915  0.498855        0.0  15.457507             0.122509       0.042428  TTTGTGTTCGTCCCAT-1    24172     25830      CD8 TEx  -8.256992  -3.043979  TTTGTGTTCGTCCCAT-1
39TTTGTGTTCTCTTCCT-1        5429  0.461569        0.0  19.229330             0.173898       0.006765  TTTGTGTTCTCTTCCT-1    10422     10858         Treg   2.174267  -8.784227  TTTGTGTTCTCTTCCT-1
40TTTGTGTTCTGCCGAG-1        3275  0.425842        0.0  16.528926             0.151769       0.018755  TTTGTGTTCTGCCGAG-1     6310      6550  Naive CD8 T  -0.882584   1.916430  TTTGTGTTCTGCCGAG-1
41
42[36721 rows x 13 columns]
2.7.1.3 The result data of method g-ChromVAR: H5AD file
Read the information of sample_id_1 + FINEMAP.
obs: Cellvar: Trait or diseaseX: Z-score
 1>>> data
 2AnnData object with n_obs × n_vars = 36721 × 15805
 3    obs: 'f_sample_id', 'f_barcodes', 'f_cell_type', 'f_sample', 'f_umap_x', 'f_umap_y', 'f_tsse', 'f_index', 'f_cell_type_index'
 4    var: 'f_trait_id', 'f_trait_code', 'f_source_genome', 'f_trait_abbr', 'f_trait', 'f_variant_count'
 5>>>
 6>>> data.var
 7                    f_trait_id                               f_trait_code f_source_genome                 f_trait_abbr                                            f_trait  f_variant_count
 8f_trait_id
 9trait_id_826      trait_id_826          CAUSALdb_Appendicitis_PE06234_672            hg19         Appendicitis_PE06234                                       Appendicitis               13
10trait_id_2146    trait_id_2146                  CAUSALdb_COE_FG02496_3096            hg19                  COE_FG02496                                Cancer of esophagus                2
11trait_id_3466    trait_id_3466  CAUSALdb_EHKPCAORROACYBNITLY_FG00466_5927            hg19  EHKPCAORROACYBNITLY_FG00466  Ever had known person concerned about, or reco...                1
12trait_id_1156    trait_id_1156                  CAUSALdb_BNT_F900340_4465            hg19                  BNT_F900340                            Benign neoplasm: Testis                1
13trait_id_1816    trait_id_1816                   CAUSALdb_CI_FG00089_4526            hg19                   CI_FG00089                                      Carrot intake               21
14...                        ...                                        ...             ...                          ...                                                ...              ...
15trait_id_15801  trait_id_15801                            UKBB_Worrier_43            hg19                      Worrier                                            Worrier             5683
16trait_id_15802  trait_id_15802                     UKBB_Worry_Too_Long_85            hg19               Worry_Too_Long                 Worry too long after embarrassment             3225
17trait_id_15803  trait_id_15803                                UKBB_eBMD_6            hg19                         eBMD                Estimated heel bone mineral density            37155
18trait_id_15804  trait_id_15804                               UKBB_eGFR_15            hg19                         eGFR  Estimated glomerular filtration rate (serum cr...            35955
19trait_id_15805  trait_id_15805                             UKBB_eGFRcys_3            hg19                      eGFRcys   Estimated glomerular filtration rate (cystain C)            37319
20
21[15805 rows x 6 columns]
22>>>
23>>> data.obs
24                    f_sample_id          f_barcodes  f_cell_type   f_sample   f_umap_x   f_umap_y     f_tsse  f_index  f_cell_type_index
25index
26AAACGAAAGAACGACC-1  sample_id_1  AAACGAAAGAACGACC-1      Tumor 4  GSE129785  10.567199  -4.781785  14.751286        1                  0
27AAACGAAAGAATACTG-1  sample_id_1  AAACGAAAGAATACTG-1      Myeloid  GSE129785   1.443223  13.324852  14.333112        2                  0
28AAACGAAAGACACGGT-1  sample_id_1  AAACGAAAGACACGGT-1         Treg  GSE129785  -1.004199  -7.261578  23.241852        3                  0
29AAACGAAAGACCCTAT-1  sample_id_1  AAACGAAAGACCCTAT-1            B  GSE129785  -5.697628  13.187097  21.428571        4                  0
30AAACGAAAGAGGTACC-1  sample_id_1  AAACGAAAGAGGTACC-1      CD8 TEx  GSE129785  -5.956334  -3.010488  20.920746        5                  0
31...                         ...                 ...          ...        ...        ...        ...        ...      ...                ...
32TTTGTGTTCGAGGCTC-1  sample_id_1  TTTGTGTTCGAGGCTC-1         Treg  GSE129785   1.477226  -8.637981  17.623604    36717               4065
33TTTGTGTTCGGGTCCA-1  sample_id_1  TTTGTGTTCGGGTCCA-1         Treg  GSE129785   2.348910  -6.036977  24.892704    36718               4066
34TTTGTGTTCGTCCCAT-1  sample_id_1  TTTGTGTTCGTCCCAT-1      CD8 TEx  GSE129785  -8.256992  -3.043979  15.457507    36719               3897
35TTTGTGTTCTCTTCCT-1  sample_id_1  TTTGTGTTCTCTTCCT-1         Treg  GSE129785   2.174267  -8.784227  19.229330    36720               4067
36TTTGTGTTCTGCCGAG-1  sample_id_1  TTTGTGTTCTGCCGAG-1  Naive CD8 T  GSE129785  -0.882584   1.916430  16.528926    36721               2767
37
38[36721 rows x 9 columns]
39>>>
40>>> data.X.todense()
41matrix([[ 0.        ,  0.        ,  0.        , ...,  1.34798235,
42          0.13897425,  0.46950752],
43        [ 0.        ,  0.        ,  0.        , ..., -0.27093183,
44         -0.28416698,  0.2759976 ],
45        [ 0.        ,  0.        ,  0.        , ..., -0.6249468 ,
46          0.11480793, -1.2071487 ],
47        ...,
48        [ 0.        ,  0.        ,  0.        , ..., -0.40784247,
49          0.35490693, -0.85452906],
50        [ 0.        ,  0.        ,  0.        , ...,  0.50343663,
51          0.07536454,  0.42840868],
52        [ 0.        ,  0.        ,  0.        , ..., -0.82765052,
53          0.20382107,  0.89792407]])
2.7.1.4 The result data of method SCAVENGE: H5AD file
Read the information of sample_id_1 + FINEMAP.
obs: Cellvar: Trait or diseaseX: TRS
 1>>> data
 2AnnData object with n_obs × n_vars = 36721 × 15805
 3    obs: 'f_sample_id', 'f_barcodes', 'f_cell_type', 'f_sample', 'f_umap_x', 'f_umap_y', 'f_tsse', 'f_index', 'f_cell_type_index'
 4    var: 'f_trait_id', 'f_trait_code', 'f_source_genome', 'f_trait_abbr', 'f_trait', 'f_variant_count'
 5>>>
 6>>>
 7>>> data.X.todense()
 8matrix([[0.        , 0.        , 0.        , ..., 0.11992209, 0.26094234,
 9         0.35693139],
10        [0.        , 0.        , 0.        , ..., 0.50589785, 2.59232072,
11         1.68724861],
12        [0.        , 0.        , 0.        , ..., 0.10034563, 0.40161146,
13         0.31860852],
14        ...,
15        [0.        , 0.        , 0.        , ..., 0.03006235, 0.37951727,
16         0.08840483],
17        [0.        , 0.        , 0.        , ..., 0.09616686, 0.52534063,
18         0.47852776],
19        [0.        , 0.        , 0.        , ..., 0.21577299, 0.47587153,
20         0.39203965]])
21>>>
2.7.2 Download fine-mapping result data for each sample
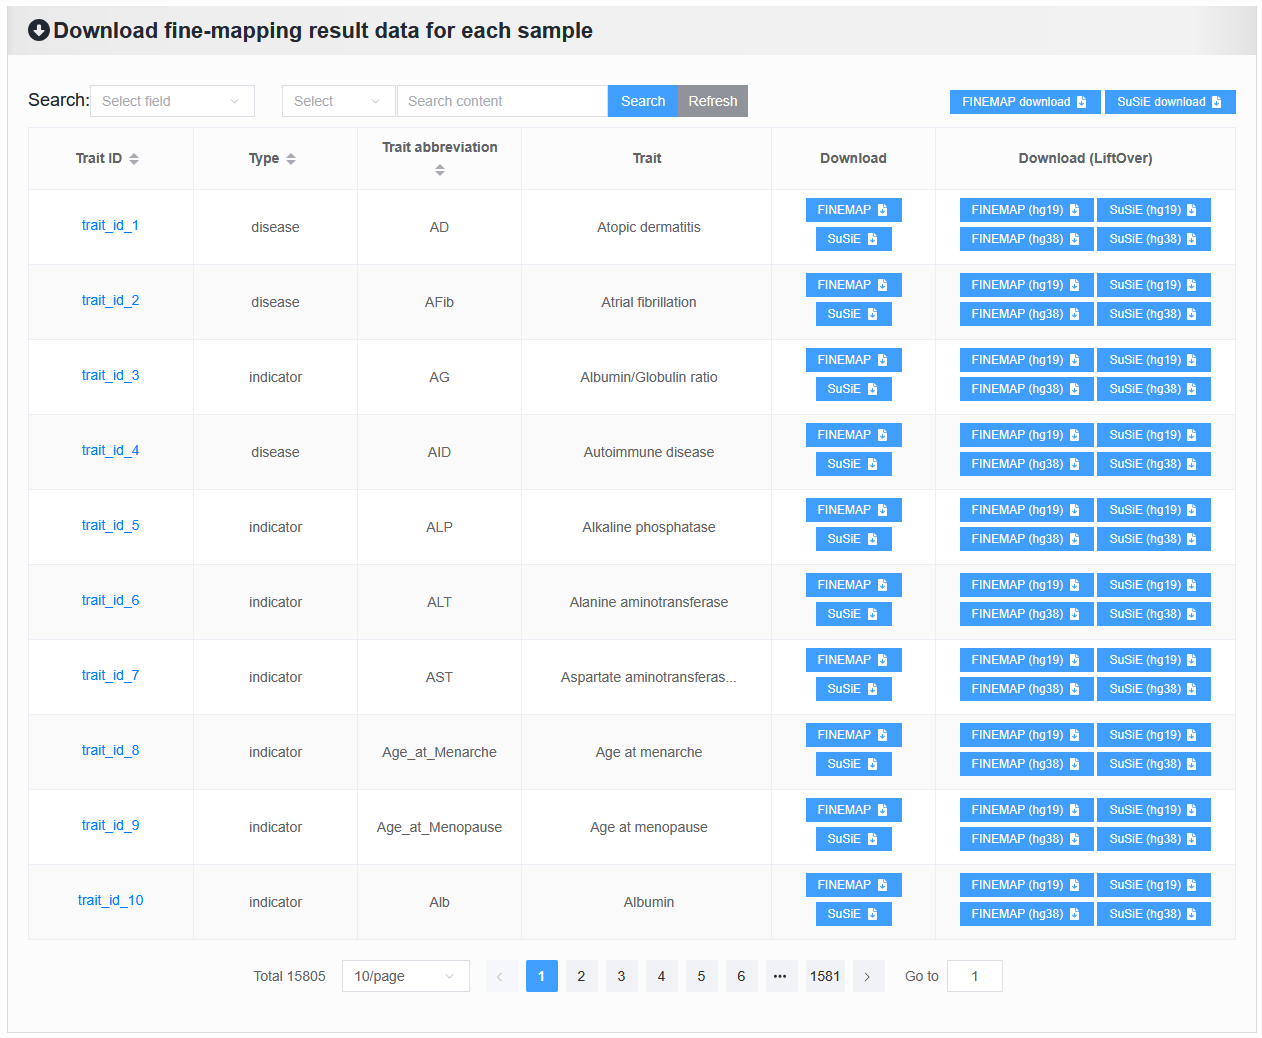
Below are the detailed download instructions.
2.7.2.1 Overview of fine-mapping result data: xlsx file
# |
Column name |
Description |
|---|---|---|
1 |
f_trait_id |
The unique identifier of the trait used for searching in the database. |
2 |
f_trait_index |
The unique identifier of the trait, used for sorting in the database, corresponds one-to-one with ‘f_trait_id’. |
3 |
f_trait_code |
The unique identifier of the trait, used as the file name for the file processing procedure. |
4 |
f_trait_abbr |
The abbreviation form of the trait. |
5 |
f_trait |
Detailed information for the trait. |
6 |
f_type |
The trait is classified as one of the types of “disease”, “drug”, “compound”, “health”, “subject”, “treatment”, “symptom”, “indicator” or “other”. |
7 |
f_icd10 |
ICD-10 |
8 |
f_category |
Major categories in ICD-10 |
9 |
f_sub_category |
Subcategories in ICD-10 |
10 |
f_three_category |
The third category in ICD-10 |
11 |
f_source_id |
Unique ID of the trait source cohort. |
12 |
f_source_name |
Name of the trait source cohort. |
13 |
f_source_genome |
Reference genome of trait source cohort. (Reference genome of the trait before LiftOver) |
14 |
f_variant_count |
The number of variant in the trait before LiftOver. |
15 |
f_variant_pp_sum |
The total PP value of variant in the trait before LiftOver. |
16 |
f_hg19_count |
The number of variant in the trait based on hg19 as a background reference genome. |
17 |
f_hg38_count |
The number of variant in the trait based on hg38 as a background reference genome. |
18 |
f_hg19_pp_sum |
The total PP value of variant in the trait based on hg19 as a background reference genome. |
19 |
f_hg38_pp_sum |
The total PP value of variant in the trait based on hg38 as a background reference genome. |
20 |
f_cohort |
The cohort for collecting the trait. |
21 |
f_author |
The author of the origin of the trait. |
22 |
f_mesh_id |
MESH ID |
23 |
f_mesh_term |
MESH TERM |
24 |
f_meta_id |
META ID |
25 |
f_popu |
Experimental population |
26 |
f_pmid |
PMID |
27 |
f_n_case |
Case size |
28 |
f_n_control |
Control size |
29 |
f_sample_size |
Sample size |
30 |
f_filter |
Each trait is retained, with a value of 1 for all. |
31 |
f_index |
The unique index identifier given in the same source cohort has no meaning and is only used to distinguish different traits in the same source cohort. |
32 |
f_url |
The link to download the source of each trait. |
2.7.2.2 Fine-mapping result data
txtfile (Downloadfield)
This file was formed through uniform processing after the original download.
# |
Column name |
Description |
|---|---|---|
1 |
trait_code |
unique identifier of the trait, used as the file name for the file processing procedure |
2 |
chr |
chromosome in the reference genome coordinate of the source cohort |
3 |
position |
position of variant in the reference genome coordinate of the source cohort |
4 |
variant |
unique variant identifier |
5 |
rsId |
rsID identifier |
6 |
allele1 |
reference allele in the reference genome coordinate of the source cohort |
7 |
allele2 |
alternative allele in the reference genome coordinate of the source cohort. (This allele is the effect allele.) |
8 |
maf |
allele frequency of the minor allele in cohort |
9 |
af |
allele frequency of allele2 (alt) |
10 |
beta |
marginal association effect size from linear mixed model/effect size GWAS |
11 |
se |
standard error on marginal association effect size from linear mixed model/standard error GWAS |
12 |
p_value |
p-value GWAS |
13 |
chisq |
test statistic for marginal association |
14 |
z_score |
original z-score |
15 |
pp |
posterior probability of association from fine-mapping (FINEMAP or SuSiE) |
16 |
beta_posterior |
posterior expectation of true effect size |
17 |
sd_posterior |
posterior standard deviation of true effect size |
18 |
trait_abbr |
abbreviation for the trait |
19 |
trait |
detailed information for the trait |
20 |
index |
Unique index identifiers based on trait or disease variants are meaningless and can be used to identify the uniqueness of variants. |
Note
When collecting fine-mapping result data, some data may not include all columns, and a small number of columns may have null values. Of course, the four columns of “chr”, “position”, “pp”, and “trait” are definitely included.
bedfile (Download (LiftOver)field)
scVMAP provides variant coordinates under different reference genomes.
# |
Column name |
Description |
|---|---|---|
1 |
None |
chromosome in hg19/hg38 coordinates |
2 |
None |
(start) position of variant in hg19/hg38 coordinates |
3 |
None |
(end) position of variant in hg19/hg38 coordinates |
4 |
None |
rsID identifier |
5 |
None |
posterior probability of association from fine-mapping (FINEMAP or SuSiE) |
6 |
None |
abbreviation for the trait |
7 |
None |
Unique index identifiers based on trait or disease variants are meaningless and can be used to identify the uniqueness of variants. |
Note
This format of data is suitable for performing overlay operations with enhancer data, etc.
Note
The download name is the same regardless of the method or reference genome selected, so please be aware of this.
2.7.3 Download other data
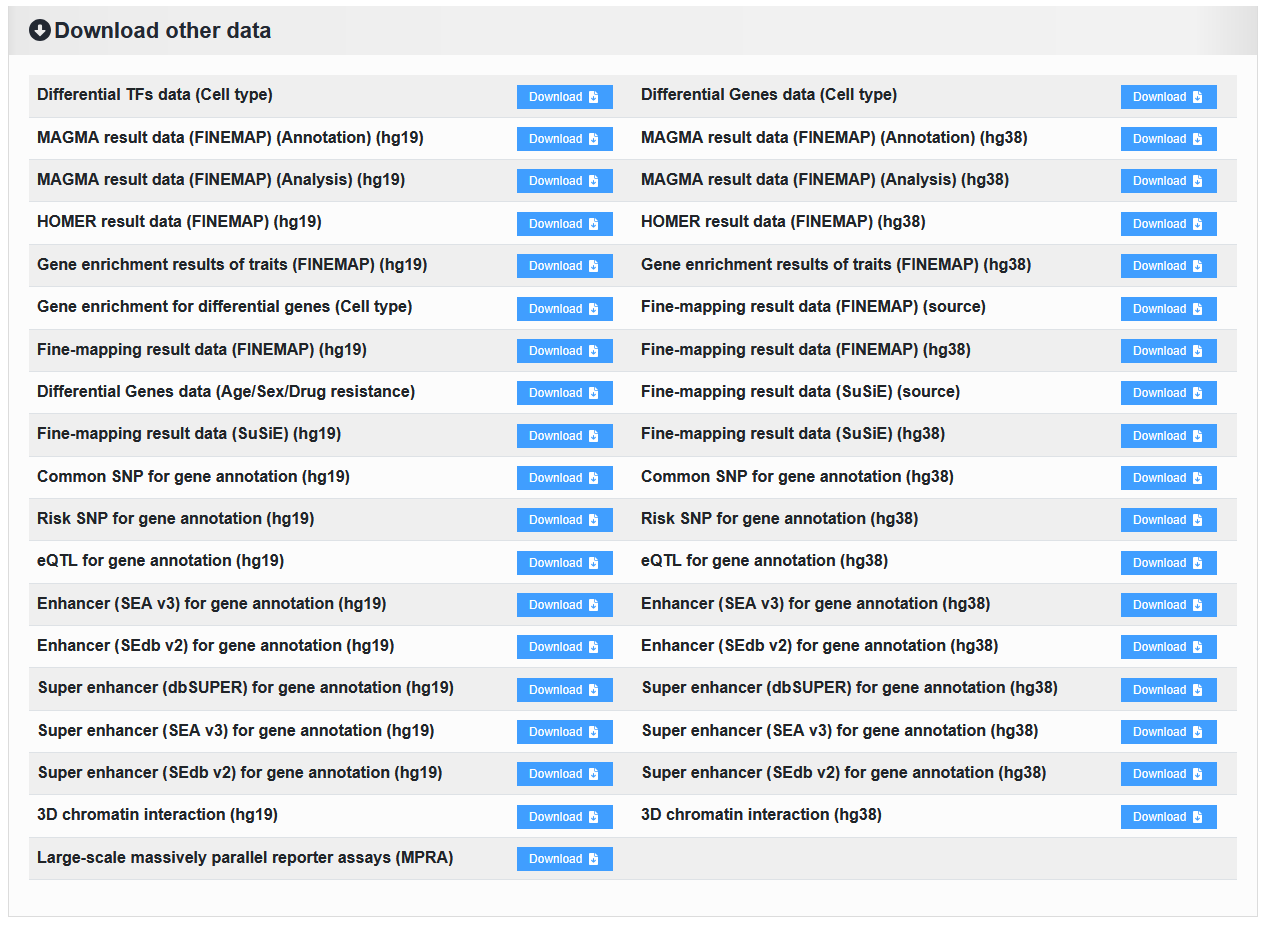
2.7.3.1 Fine-mapping result data: tar.gz file
Here is the complete download for Part 2.7.2 Download fine-mapping result data for each sample.
Fine-mapping result data (FINEMAP/SuSiE) (source):txtfile (Downloadfield)Repeat display once:
# |
Column name |
Description |
|---|---|---|
1 |
trait_code |
unique identifier of the trait, used as the file name for the file processing procedure |
2 |
chr |
chromosome in the reference genome coordinate of the source cohort |
3 |
position |
position of variant in the reference genome coordinate of the source cohort |
4 |
variant |
unique variant identifier |
5 |
rsId |
rsID identifier |
6 |
allele1 |
reference allele in the reference genome coordinate of the source cohort |
7 |
allele2 |
alternative allele in the reference genome coordinate of the source cohort. (This allele is the effect allele.) |
8 |
maf |
allele frequency of the minor allele in cohort |
9 |
af |
allele frequency of allele2 (alt) |
10 |
beta |
marginal association effect size from linear mixed model/effect size GWAS |
11 |
se |
standard error on marginal association effect size from linear mixed model/standard error GWAS |
12 |
p_value |
p-value GWAS |
13 |
chisq |
test statistic for marginal association |
14 |
z_score |
original z-score |
15 |
pp |
posterior probability of association from fine-mapping (FINEMAP) |
16 |
beta_posterior |
posterior expectation of true effect size |
17 |
sd_posterior |
posterior standard deviation of true effect size |
18 |
trait_abbr |
abbreviation for the trait |
19 |
trait |
detailed information for the trait |
20 |
index |
Unique index identifiers based on trait or disease variants are meaningless and can be used to identify the uniqueness of variants. |
Fine-mapping result data (FINEMAP/SuSiE) (hg19/hg38):bedfile (Download (LiftOver)field)Repeat display once:
# |
Column name |
Description |
|---|---|---|
1 |
None |
chromosome in hg19/hg38 coordinates |
2 |
None |
(start) position of variant in hg19/hg38 coordinates |
3 |
None |
(end) position of variant in hg19/hg38 coordinates |
4 |
None |
rsID identifier |
5 |
None |
posterior probability of association from fine-mapping (FINEMAP or SuSiE) |
6 |
None |
abbreviation for the trait |
7 |
None |
Unique index identifiers based on trait or disease variants are meaningless and can be used to identify the uniqueness of variants. |
2.7.3.2 Differential gene data: txt file
Differential Genes data (Cell type):tar.gzfile
This file contains differential gene data for all cell types of single-cell samples. Of course, it is after passing the threshold.
# |
Column name |
Description |
|---|---|---|
1 |
f_sample_id |
unique identifier of scATAC-seq sample |
2 |
f_cell_type |
cell type |
3 |
f_gene |
gene name |
4 |
f_score |
score |
5 |
f_adjusted_p_value |
adjusted p value |
6 |
f_log2_fold_change |
Log2(Fold change) |
7 |
f_p_value |
P-value |
Differential Genes data (Age/Sex/Drug resistance):txtfile
This file contains differential gene data for all cell types of single-cell samples. Of course, it is after passing the threshold.
# |
Column name |
Description |
|---|---|---|
1 |
f_sample_id |
unique identifier of scATAC-seq sample |
2 |
f_type_value |
Corresponds to the values under the f_type field. |
3 |
f_gene |
gene name |
4 |
f_score |
score |
5 |
f_adjusted_p_value |
adjusted p value |
6 |
f_log2_fold_change |
Log2(Fold change) |
7 |
f_p_value |
P-value |
7 |
f_type |
Age, gender, or drug resistance information. |
Note
You need to download the complete data without threshold filtering, and enter the details page of the sample to download the H5AD file.
Example: sample_id_1
 1>>> data
 2AnnData object with n_obs × n_vars = 33501 × 20
 3    obs: 'n_cells'
 4    var: 'cell_type', 'size'
 5    uns: 'diff_genes'
 6    layers: 'adjusted_p_value', 'log2_fold_change', 'p_value'
 7>>>
 8>>> data.var
 9                     cell_type  size
10cell_type
11B                            B   404
12CD8 TEx                CD8 TEx  3898
13Effector CD8 T  Effector CD8 T  1153
14Endothelial        Endothelial   562
15Fibroblasts        Fibroblasts  1325
16Memory CD8 T      Memory CD8 T  4965
17Myeloid                Myeloid   732
18NK1                        NK1   418
19NK2                        NK2  1207
20Naive CD4 T        Naive CD4 T  4059
21Naive CD8 T        Naive CD8 T  2768
22Plasma B              Plasma B   335
23Tfh                        Tfh  4138
24Th1                        Th1   338
25Th17                      Th17  1842
26Treg                      Treg  4068
27Tumor 1                Tumor 1   757
28Tumor 2                Tumor 2   875
29Tumor 3                Tumor 3  1687
30Tumor 4                Tumor 4  1190
31>>>
32>>> data.obs
33                 n_cells
34AP006222.2           296
35ENSG00000286448      296
36ENSG00000230021    14992
37ENSG00000228327    10389
38LINC01409          10389
39...                  ...
40TMLHE               4231
41SPRY3               5205
42VAMP7               7748
43IL9R                5738
44ENSG00000270726      395
45
46[33501 rows x 1 columns]
47>>>
48>>> data.X
49array([[-16.08996773,  16.2977314 ,  -3.94544339, ...,  22.60018349,
50         65.58148956,  41.31241226],
51       [ -9.23847771,  38.57592773, -28.23983192, ...,  -8.53127384,
52         16.334095  ,  46.58874512],
53       [ -9.22247505,  38.53868484, -28.31791878, ...,  -8.08869743,
54         16.5304184 ,  46.68078613],
55       ...,
56       [ -0.73027158,  34.58570862,  42.81091309, ..., -33.24862289,
57        -56.29743958, -51.4512825 ],
58       [ 12.86117554, -13.21335506,  -1.77498877, ..., -29.03244019,
59        -39.19504929, -43.00321579],
60       [-16.56791496, -32.8029213 ,   2.89613366, ...,  38.49712753,
61         32.102005  , -17.40989685]])
62>>>
2.7.3.3 Differential TF data: txt file
This file contains differential TF data for all cell types of single-cell samples. Of course, it is after passing the threshold.
# |
Column name |
Description |
|---|---|---|
1 |
f_sample_id |
unique identifier of scATAC-seq sample |
2 |
f_cell_type |
cell type |
3 |
f_tf |
transcription factor name |
4 |
f_tf_id |
unique identifier of transcription factor |
5 |
f_p_value |
P-value |
6 |
f_adjusted_p_value |
adjusted p value |
7 |
f_log2_fold_change |
Log2(Fold change) |
Note
You need to download the complete data without threshold filtering, and enter the details page of the sample to download the H5AD file.
Example: sample_id_1
 1>>> data
 2AnnData object with n_obs × n_vars = 1165 × 20
 3    obs: 'id', 'name'
 4    var: 'cell_type', 'size'
 5    layers: 'adjusted_p_value', 'log2_fold_change'
 6>>>
 7>>> data.obs
 8                                            id        name
 9index
10AC023509.3+M02872_2.00  AC023509.3+M02872_2.00  AC023509.3
11AC138696.1+M04597_2.00  AC138696.1+M04597_2.00  AC138696.1
12AHR+M09817_2.00                AHR+M09817_2.00         AHR
13AIRE+M09375_2.00              AIRE+M09375_2.00        AIRE
14ALX1+M05327_2.00              ALX1+M05327_2.00        ALX1
15...                                        ...         ...
16ZSCAN4+M02919_2.00          ZSCAN4+M02919_2.00      ZSCAN4
17ZSCAN5+M04460_2.00          ZSCAN5+M04460_2.00      ZSCAN5
18ZSCAN5C+M08390_2.00        ZSCAN5C+M08390_2.00     ZSCAN5C
19ZSCAN9+M04466_2.00          ZSCAN9+M04466_2.00      ZSCAN9
20ZZZ3+M01272_2.00              ZZZ3+M01272_2.00        ZZZ3
21
22[1165 rows x 2 columns]
23>>>
24>>> data.X
25array([[1.01662951e-01, 1.74660328e-01, 2.50931395e-01, ...,
26        6.34538848e-02, 7.25013930e-02, 5.10951651e-05],
27       [2.07562180e-01, 1.93983057e-01, 2.10357488e-01, ...,
28        3.01950908e-01, 3.46950746e-01, 8.56932171e-02],
29       [2.40413032e-01, 9.76634287e-02, 6.66147596e-01, ...,
30        2.68301581e-01, 1.75328527e-02, 1.26211337e-03],
31       ...,
32       [4.38363454e-01, 1.43397437e-01, 4.24778841e-01, ...,
33        7.15759727e-03, 5.41759614e-02, 9.35845828e-12],
34       [4.86767592e-01, 1.47841135e-01, 5.32381338e-01, ...,
35        2.74014131e-01, 1.13489445e-05, 6.38005942e-11],
36       [1.61418404e-01, 3.23724955e-01, 4.50586827e-02, ...,
37        2.66768124e-01, 7.84328678e-02, 4.08885306e-07]])
38>>>
2.7.3.4 MAGMA result data: tar.gz file
The result data of enriched genes for traits or diseases through MAGMA.
MAGMA result data (Annotation) (hg19/hg38):AnnotationMAGMA result data (Analysis) (hg19/hg38):Gene analysis -raw data
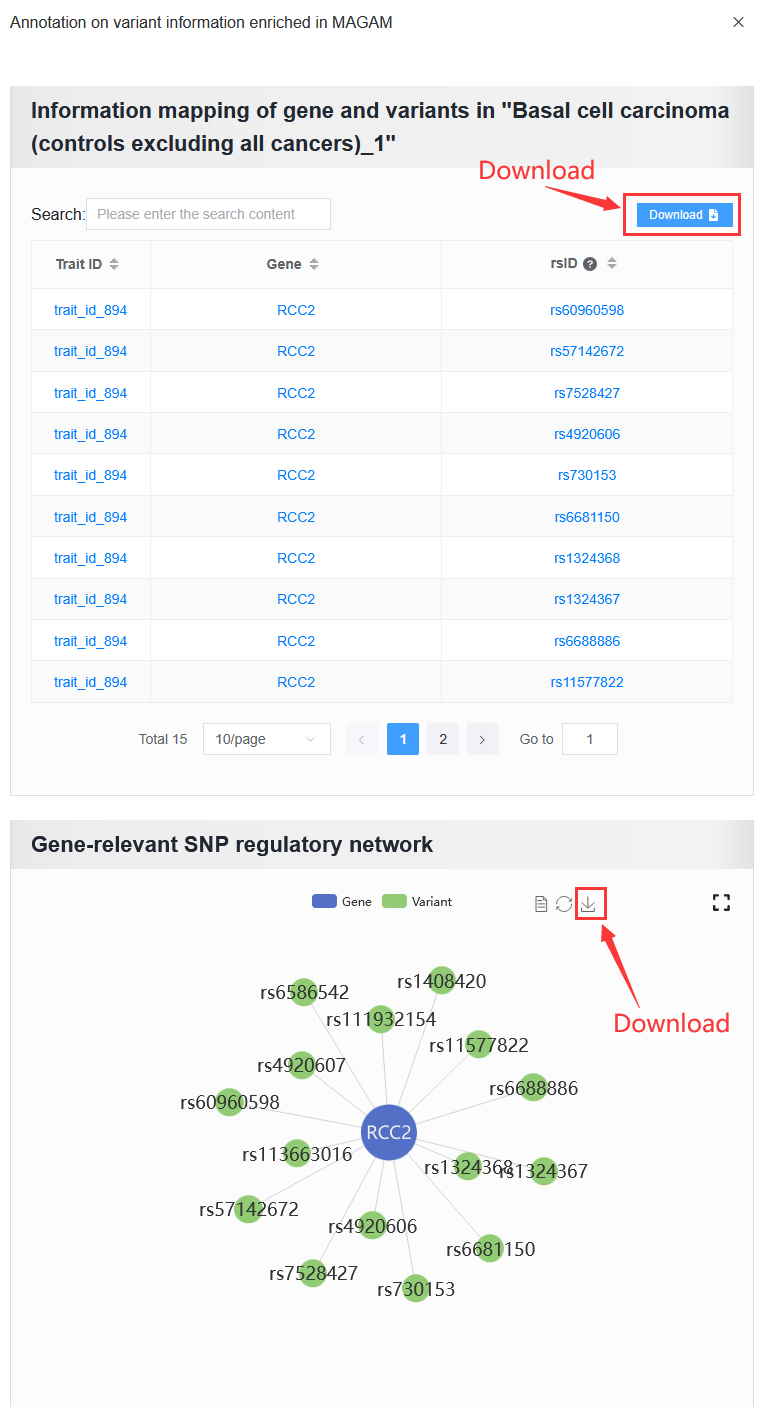
2.7.3.4.1 Annotation: txt file (After decompression)
# |
Column name |
Description |
|---|---|---|
1 |
trait_id |
unique identifier of trait or disease |
2 |
gene_id |
unique identifier of gene |
3 |
gene |
gene name |
4 |
rsId |
rsID identifier |
Note
The user needs to obtain the genes.annot file after MAGMA runs and needs to enter the details page to obtain it.
Example: trait_id_894
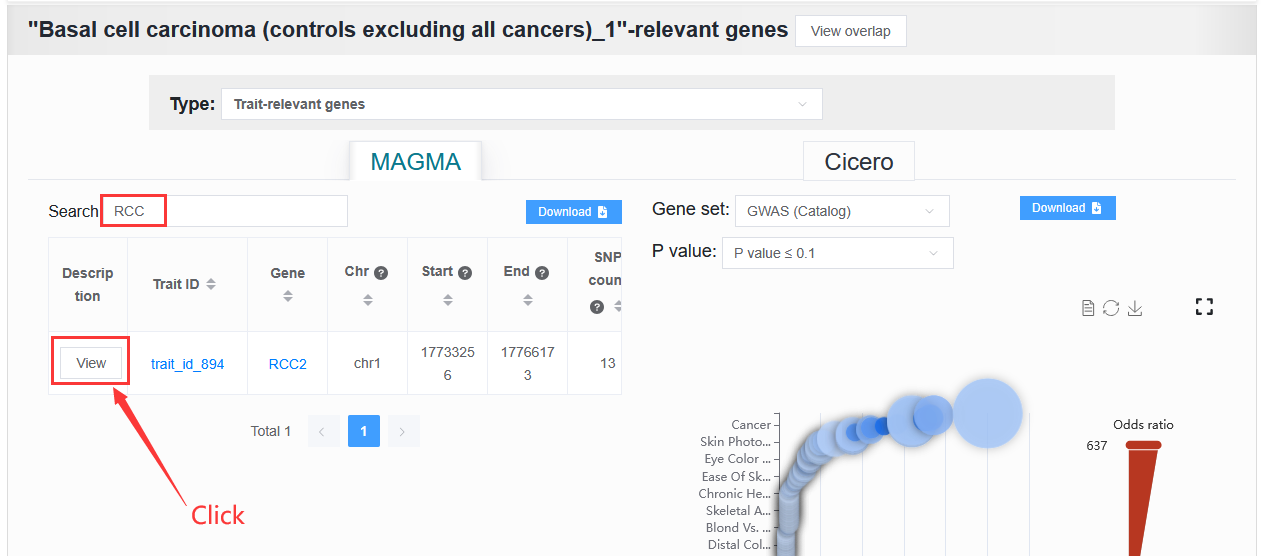
Click View
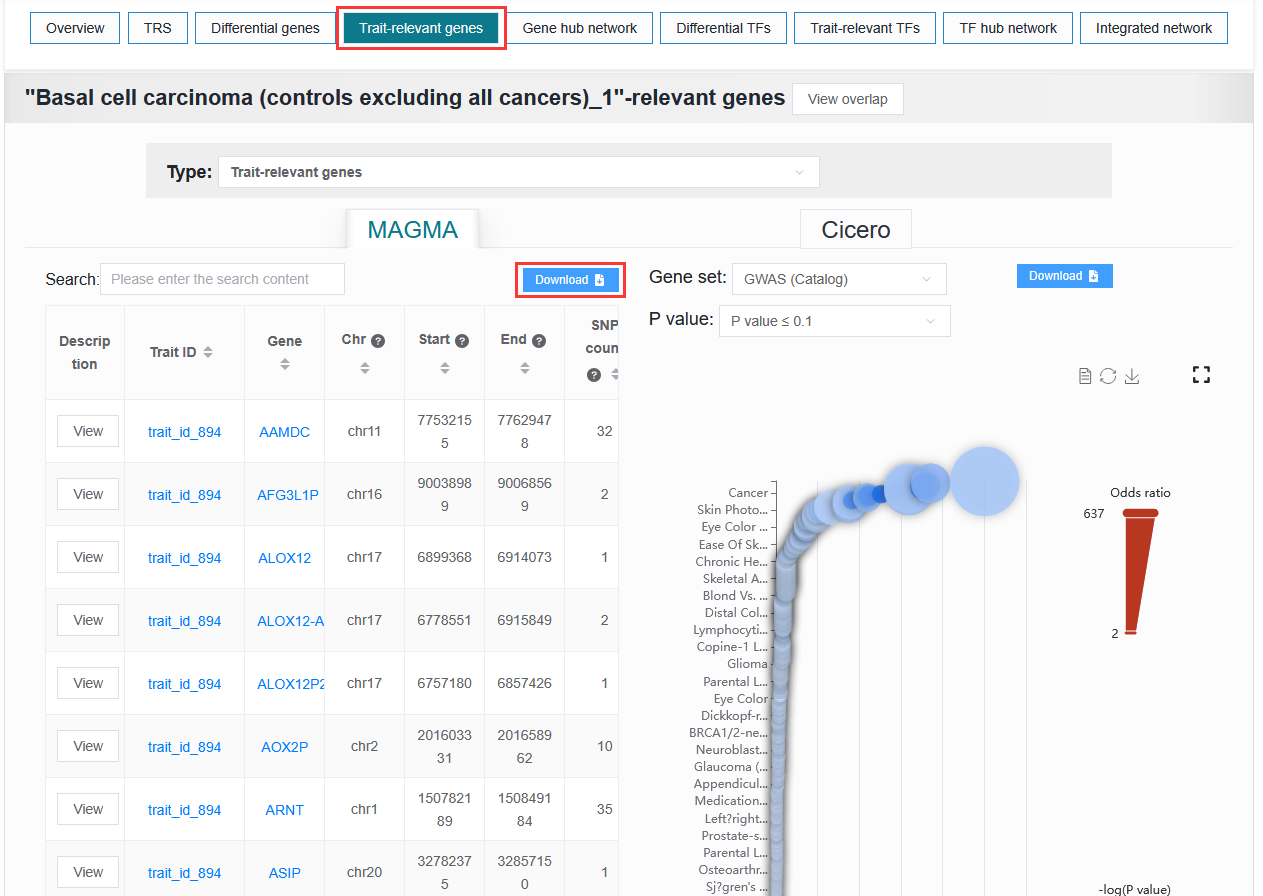
2.7.3.4.1 Gene analysis -raw data: txt file (After decompression)
# |
Column name |
Description |
|---|---|---|
1 |
trait_id |
unique identifier of trait or disease |
2 |
gene_id |
unique identifier of gene |
3 |
gene |
gene name |
4 |
chr |
chromosome code |
5 |
start |
starting boundary of gene annotation on chromosomes |
6 |
end |
ending boundary of gene annotation on chromosomes |
7 |
n_snps |
The number of SNPs not annotated to this gene based on previous SNP QC exclusion. |
8 |
z_score |
z-value |
9 |
p_value |
p-value |
Note
The user needs to obtain the genes.out file after MAGMA runs and needs to enter the details page to obtain it.
Example: trait_id_894
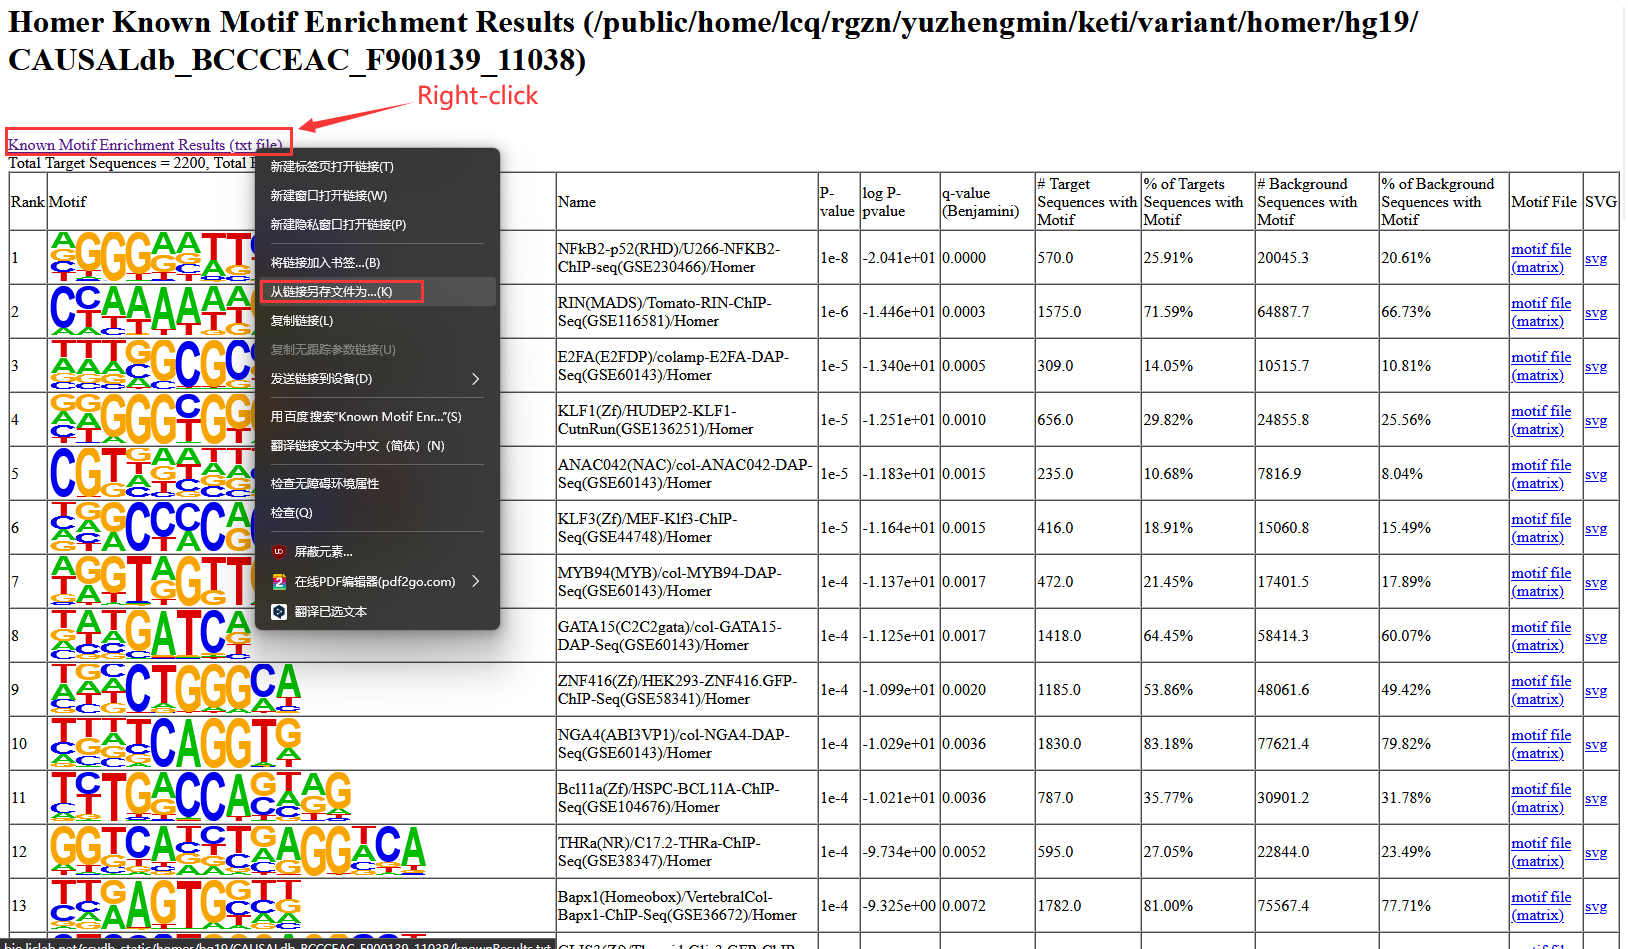
2.7.3.5 HOMER result data: tar.gz file
HOMER result data (hg19/hg38):txtfile (After decompression)
# |
Column name |
Description |
|---|---|---|
1 |
f_trait_id |
unique identifier of trait or disease |
2 |
f_motif_name |
unique identifier of gene |
3 |
f_tf |
TF name |
4 |
f_consensus |
consensus |
5 |
f_p_value |
p-value |
6 |
f_q_value |
q-value |
Note
Users need to download complete data without threshold filtering and enter the details page to download the file.
Example: trait_id_894
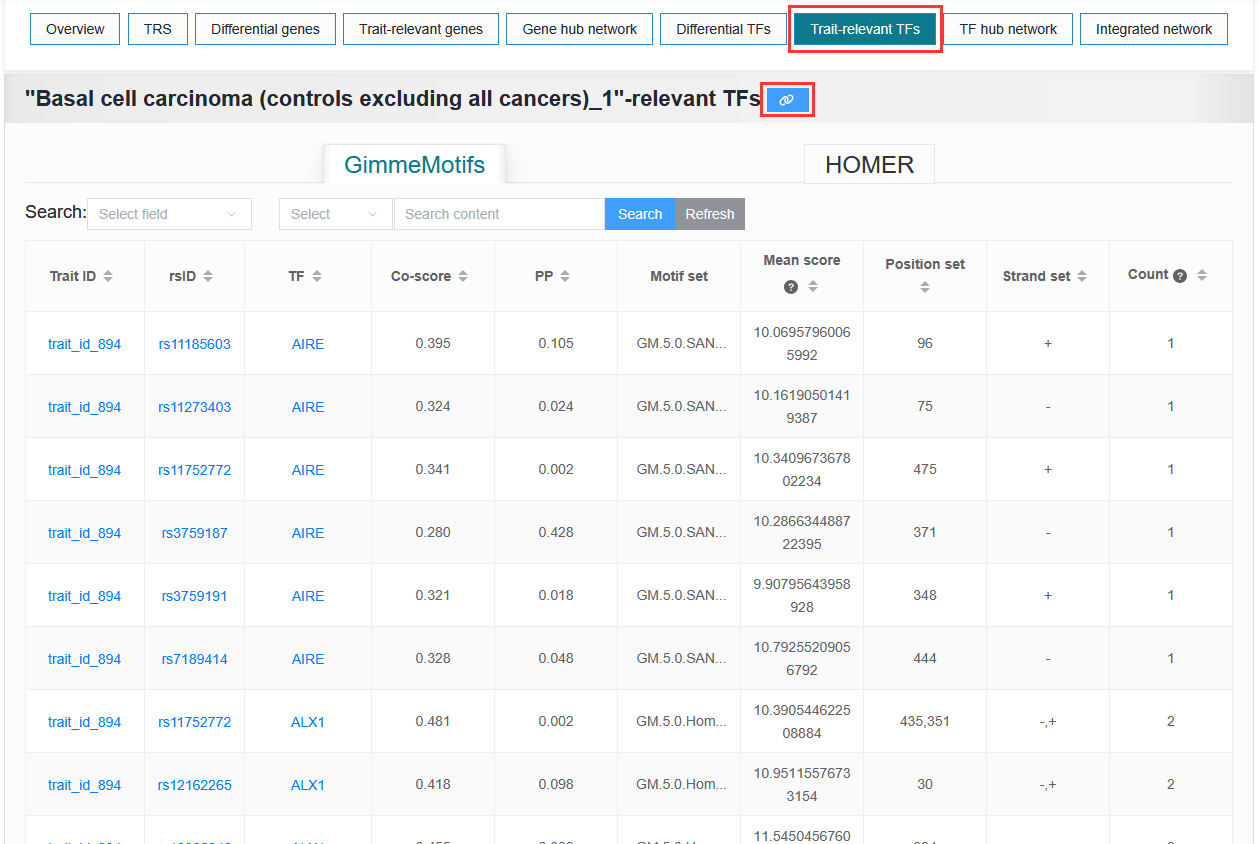
Click on the link symbol button.
2.7.3.6 Gene enrichment analysis results: tar.gz file
Gene enrichment for differential genes:txtfile (After decompression)Gene enrichment results of traits (hg19/hg38):txtfile (After decompression)
2.7.3.6.1 Gene enrichment for differential genes
File name: {Sample ID}_gene_enrichment_data.txt
# |
Column name |
Description |
|---|---|---|
1 |
f_gene_set |
Gene set (GO_Biological_Process_2023, GO_Cellular_Component_2023, GO_Molecular_Function_2023 and GWAS_Catalog_2023) |
2 |
f_term |
gene enrichment term |
3 |
f_overlap |
percentage of gene set overlap |
4 |
f_p_value |
p-value |
5 |
f_adjusted_p_value |
adjusted p-value |
6 |
f_odds_ratio |
odds ratio |
7 |
f_combined_score |
combined score |
8 |
f_gene |
overlap genes |
9 |
f_count |
count of overlapping genes |
10 |
f_cell_type |
cell type |
2.7.3.6.2 Gene enrichment results of traits (hg19/hg38)
File name: {Trait label}_gene_enrichment_trait_data.txt
# |
Column name |
Description |
|---|---|---|
1 |
trait_id |
unique identifier of trait or disease |
2 |
Gene_set |
Gene set (GO_Biological_Process_2023, GO_Cellular_Component_2023, GO_Molecular_Function_2023 and GWAS_Catalog_2023) |
3 |
Term |
gene enrichment term |
4 |
Overlap |
percentage of gene set overlap |
5 |
P-value |
p-value |
6 |
Adjusted P-value |
adjusted p-value |
7 |
Old P-value |
old p-value |
8 |
Old Adjusted P-value |
old adjusted p-value |
9 |
Odds Ratio |
odds ratio |
10 |
Combined Score |
combined score |
11 |
Genes |
overlap genes |
Note
A very small number of traits or diseases contain too few fine-mapped variants, resulting in a lack of gene enrichment results.
2.7.3.7 Gene regulation/V2G annotation data:
scVMAP provides gene regulation annotation data for five types of epigenome data.
2.7.3.7.1 Common SNP: txt file (After decompression)
# |
Column name |
Description |
|---|---|---|
1 |
chr |
chromosome |
2 |
position |
position |
3 |
rsId |
rsID identifier |
4 |
ref |
reference allele in the reference genome coordinate of the source cohort |
5 |
alt |
alternative allele in the reference genome coordinate of the source cohort. (This allele is the effect allele.) |
 1$ head dbsnp_common_snp_hg38.txt
 2chr     position        rsId    ref     alt
 3chr1    10177   rs367896724     A       AC
 4chr1    10352   rs555500075     T       TA
 5chr1    10616   rs376342519     CCGCCGTTGCAAAGGCGCGCCG  C
 6chr1    11012   rs544419019     C       G
 7chr1    11063   rs561109771     T       G
 8chr1    13110   rs540538026     G       A
 9chr1    13116   rs62635286      T       G
10chr1    13118   rs62028691      A       G
11chr1    13273   rs531730856     G       C
2.7.3.7.2 eQTL: txt file (After decompression)
# |
Column name |
Description |
|---|---|---|
1 |
chr |
chromosome |
2 |
position |
position |
3 |
ref |
reference allele in the reference genome coordinate of the source cohort |
4 |
alt |
alternative allele in the reference genome coordinate of the source cohort. (This allele is the effect allele.) |
5 |
gene_name |
gene name |
6 |
tss_distance |
The distance between SNP and gene transcription start site (TSS). |
7 |
af |
allele frequency of alternative allele (alt) |
8 |
pval_nominal |
p-value |
9 |
tissue_type |
tissue type |
 1$ head gtex_v10_eqtl_hg38.txt
 2chr     position        ref     alt     gene_name       tss_distance    af      pval_nominal    tissue_type
 3chr1    766455  T       C       LINC01409       -12292  0.047058824     1.7230692640469627e-10  Vagina
 4chr1    766938  C       T       LINC01409       -11809  0.047058824     7.331238896267609e-10   Vagina
 5chr1    771358  T       G       LINC01409       -7389   0.047058824     3.298544072962652e-12   Vagina
 6chr1    771398  G       A       LINC01409       -7349   0.67058825      2.133429762259741e-05   Vagina
 7chr1    775571  G       T       LINC01409       -3176   0.047058824     3.298544072962652e-12   Vagina
 8chr1    777550  T       C       LINC01409       -1197   0.05    9.539419071495843e-12   Vagina
 9chr1    777751  A       AT      LINC01409       -996    0.05    9.539419071495843e-12   Vagina
10chr1    778534  A       G       LINC01409       -213    0.05    9.539419071495843e-12   Vagina
11chr1    778639  A       G       LINC01409       -108    0.08235294      2.6823764300049156e-08  Vagina
2.7.3.7.3 Risk SNP: txt file (After decompression)
# |
Column name |
Description |
|---|---|---|
1 |
chr |
chromosome |
2 |
pos |
position |
3 |
rsId |
rsID identifier |
4 |
ref |
reference allele in the reference genome coordinate of the source cohort |
5 |
alt |
alternative allele in the reference genome coordinate of the source cohort. (This allele is the effect allele.) |
6 |
p |
p-value |
7 |
Trait |
trait |
8 |
Population |
population |
9 |
PMID |
PMID |
 1$ head gwasatlas_v20191115_risk_snp_hg38.txt
 2chr     pos     rsID    ref     alt     p       Trait   Population      PMID
 3chr1    43718521        rs11420276      G       GT      6.452e-13       Attention deficit hyperactivity disorder        EUR     30478444
 4chr1    96136884        rs1222063       A       G       3.068e-08       Attention deficit hyperactivity disorder        EUR     30478444
 5chr3    20627579        rs4858241       G       T       8.172e-09       Attention deficit hyperactivity disorder        EUR     30478444
 6chr4    31149834        rs28411770      C       T       1.152e-08       Attention deficit hyperactivity disorder        EUR     30478444
 7chr5    88558577        rs4916723       A       C       1.807e-08       Attention deficit hyperactivity disorder        EUR     30478444
 8chr5    88919777        rs304132        A       G       3.047e-08       Attention deficit hyperactivity disorder        EUR     30478444
 9chr7    114418676       rs34291892      C       CA      1.585e-08       Attention deficit hyperactivity disorder        EUR     30478444
10chr8    34495092        rs74760947      A       G       1.393e-08       Attention deficit hyperactivity disorder        EUR     30478444
11chr10   104987596       rs11591402      A       T       1.76e-08        Attention deficit hyperactivity disorder        EUR     30478444
2.7.3.7.4 Enhancer (SEA v3): txt file (After decompression)
# |
Column name |
Description |
|---|---|---|
1 |
chr |
chromosome |
2 |
start |
start position of enhancer |
3 |
end |
end position of enhancer |
4 |
associated_gene |
reference allele in the reference genome coordinate of the source cohort |
5 |
cell_tissue_type |
cell type/tissue type |
6 |
recognition_factor |
recognition factor (eg. h3k27ac) |
7 |
sequence_region |
sequence region (coding or noncoding) |
8 |
se_id |
SE ID of SEA |
 1$ head sea_v3_enhancer_hg38.txt
 2chr     start   end     associated_gene cell_tissue_type        recognition_factor      sequence_region se_id
 3chr10   88384139        88389120        RNLS    22Rv1   h3k27ac coding  442
 4chr13   20117533        20129315        LINC01072       22Rv1   h3k27ac noncoding       443
 5chr11   9056277 9061918 SCUBE2  22Rv1   h3k27ac coding  444
 6chr5    44537047        44541439        LINC02224       22Rv1   h3k27ac noncoding       445
 7chr9    112327808       112339994       PTBP3   22Rv1   h3k27ac coding  446
 8chr4    138896634       138913955       LOC105377448    22Rv1   h3k27ac noncoding       447
 9chr2    180254341       180260431       CWC22   22Rv1   h3k27ac coding  448
10chrX    66898375        66921461        EDA2R   22Rv1   h3k27ac coding  449
11chr7    12709011        12717389        ARL4A   22Rv1   h3k27ac coding  450
2.7.3.7.5 Enhancer (SEdb v2): txt file (After decompression)
# |
Column name |
Description |
|---|---|---|
1 |
chr |
chromosome |
2 |
start |
start position of enhancer |
3 |
end |
end position of enhancer |
4 |
sample_id |
sample ID of SEdb |
5 |
se_id |
SE ID of SEdb |
6 |
cell_source |
source |
7 |
cell_type |
cell type |
8 |
tissue_type |
tissue type |
9 |
cell_state |
cell state |
 1$ head sedb_v2_enhancer_hg38.txt
 2chr     start   end     sample_id       se_id   cell_source     cell_type       tissue_type     cell_state
 3chr6    32968553        32969528        SE_00_0001      TE_00_000100001 Roadmap Tissue  Adipose adipose-tissue
 4chr19   3404076 3405134 SE_00_0001      TE_00_000100002 Roadmap Tissue  Adipose adipose-tissue
 5chr22   17638273        17639305        SE_00_0001      TE_00_000100003 Roadmap Tissue  Adipose adipose-tissue
 6chr7    100428402       100429667       SE_00_0001      TE_00_000100004 Roadmap Tissue  Adipose adipose-tissue
 7chr19   6273122 6274837 SE_00_0001      TE_00_000100005 Roadmap Tissue  Adipose adipose-tissue
 8chr17   77128730        77140351        SE_00_0001      TE_00_000100006 Roadmap Tissue  Adipose adipose-tissue
 9chr6    33313122        33314294        SE_00_0001      TE_00_000100007 Roadmap Tissue  Adipose adipose-tissue
10chr7    5555574 5556788 SE_00_0001      TE_00_000100008 Roadmap Tissue  Adipose adipose-tissue
11chr7    143380426       143381762       SE_00_0001      TE_00_000100009 Roadmap Tissue  Adipose adipose-tissue
2.7.3.7.6 Super enhancer (dbSUPER): txt file (After decompression)
# |
Column name |
Description |
|---|---|---|
1 |
chr |
chromosome |
2 |
start |
start position of enhancer |
3 |
end |
end position of enhancer |
4 |
se_id |
SE ID of SEdb |
5 |
cell_type_type |
cell type/tissue type |
 1$ head dbsuper_super_enhancer_hg38.txt
 2chr     start   end     se_id   cell_type_type
 3chr6    32580146        32643038        SE_10156        CD19 Primary
 4chr14   105557581       105606092       SE_10157        CD19 Primary
 5chr14   105677864       105749363       SE_10158        CD19 Primary
 6chr6    167078442       167154502       SE_10159        CD19 Primary
 7chr21   44137096        44181452        SE_10160        CD19 Primary
 8chr5    150398244       150436858       SE_10161        CD19 Primary
 9chr2    88831594        88886476        SE_10162        CD19 Primary
10chr6    33006818        33032650        SE_10163        CD19 Primary
11chr2    136114080       136141217       SE_10164        CD19 Primary
2.7.3.7.7 Super enhancer (SEA v3): txt file (After decompression)
# |
Column name |
Description |
|---|---|---|
1 |
chr |
chromosome |
2 |
start |
start position of enhancer |
3 |
end |
end position of enhancer |
4 |
associated_gene |
reference allele in the reference genome coordinate of the source cohort |
5 |
cell_tissue_type |
cell type/tissue type |
6 |
recognition_factor |
recognition factor (eg. h3k27ac) |
7 |
sequence_region |
sequence region (coding or noncoding) |
8 |
se_id |
SE ID |
 1$ head sea_v3_super_enhancer_hg38.txt
 2chr     start   end     associated_gene cell_tissue_type        recognition_factor      sequence_region se_id
 3chr6    110617715       110700931       CDK19   22Rv1   h3k27ac coding  1
 4chr7    92030110        92091121        AKAP9   22Rv1   h3k27ac coding  2
 5chr11   59005426        59074536        LOC283194       22Rv1   h3k27ac noncoding       3
 6chr5    71599725        71707973        MCCC2   22Rv1   h3k27ac coding  4
 7chr21   6360657 6375827 CBS     22Rv1   h3k27ac coding  5
 8chr12   101602935       101625047       MYBPC1  22Rv1   h3k27ac coding  6
 9chr10   37145277        37199659        ANKRD30A        22Rv1   h3k27ac coding  7
10chr6    138221168       138289554       ARFGEF3 22Rv1   h3k27ac coding  8
11chr16   52550656        52582081        CASC16  22Rv1   h3k27ac noncoding       9
2.7.3.7.8 Super enhancer (SEdb v2): txt file (After decompression)
# |
Column name |
Description |
|---|---|---|
1 |
chr |
chromosome |
2 |
start |
start position of enhancer |
3 |
end |
end position of enhancer |
4 |
sample_id |
sample ID of SEdb |
5 |
se_id |
SE ID of SEdb |
6 |
cell_source |
source |
7 |
cell_type |
cell type |
8 |
tissue_type |
tissue type |
9 |
cell_state |
cell state |
 1$ head sedb_v2_super_enhancer_hg38.txt
 2chr     start   end     sample_id       se_id   cell_source     cell_type       tissue_type     cell_state
 3chr1    100008001       100081709       SE_02_1036      SE_02_103600569 NCBI GEO/SRA    Cell line       Mammary gland   HCC70_XY018
 4chr1    100015493       100079709       SE_02_1429      SE_02_142900169 NCBI GEO/SRA    Cell line       Blood   GM12878_WT
 5chr1    1000160 1006599 SE_02_0988      SE_02_098800774 NCBI GEO/SRA    Cell line       Blood   K562_EPZ
 6chr1    1000180 1006408 SE_02_1080      SE_02_108000734 NCBI GEO/SRA    Cell line       Muscle  JR1 shCtrl
 7chr1    100026929       100040607       SE_00_0009      SE_00_000900816 Roadmap Primary cell    Blood   CD8-positive-alpha-beta-T-cell
 8chr1    100027783       100040448       SE_00_0027      SE_00_002700801 Roadmap Primary cell    Blood   natural-killer-cell
 9chr1    100028493       100040305       SE_02_0707      SE_02_070700751 NCBI GEO/SRA    Cell line       Pancreas        BxPC3 WT
10chr1    100028934       100040097       SE_02_0022      SE_02_002200606 NCBI GEO/SRA    Primary cell    Blood   CD8donorA
11chr1    100033978       100061969       SE_02_1468      SE_02_146800857 NCBI GEO/SRA    Cell line       Blood   HUDEP-2_WT
2.7.3.7.9 3D chromatin interaction: bed file (After decompression)
# |
Column name |
Description |
|---|---|---|
1 |
None |
chromosome (Interaction1) |
2 |
None |
start position of enhancer (Interaction1) |
3 |
None |
end position of enhancer (Interaction1) |
4 |
None |
chromosome (Interaction2) |
5 |
None |
start position of enhancer (Interaction2) |
6 |
None |
end position of enhancer (Interaction2) |
7 |
None |
Source/Interaction ID |
8 |
None |
Method |
9 |
None |
Tissue/cell type |
10 |
None |
Cell line |
 1$ head 3D_hg19.bed
 2chr1    37883731        37885731        chr1    38374488        38376488        3D_4DGenome_001 3C      Kidney  293Trex
 3chr1    68019395        68021395        chr1    68444820        68446820        3D_4DGenome_001 3C      Kidney  293Trex
 4chr1    94005332        94007332        chr1    94477646        94479646        3D_4DGenome_001 3C      Kidney  293Trex
 5chr1    9762548 9762685 chr1    9882283 9883893 3D_OncoBase_084 EpiTensor       Kidney  Kidney
 6chr1    9848832 9851345 chr1    9882283 9883893 3D_OncoBase_084 EpiTensor       Kidney  Kidney
 7chr1    98991643        98992662        chr1    99114108        99115246        3D_OncoBase_084 EpiTensor       Kidney  Kidney
 8chr1    99114108        99115246        chr1    99125090        99125899        3D_OncoBase_084 EpiTensor       Kidney  Kidney
 9chr1    98991643        98992662        chr1    99125090        99125899        3D_OncoBase_084 EpiTensor       Kidney  Kidney
10chr1    99181550        99181760        chr1    99182450        99183081        3D_OncoBase_084 EpiTensor       Kidney  Kidney
11chr1    99125090        99125899        chr1    99193746        99195271        3D_OncoBase_084 EpiTensor       Kidney  Kidney
2.7.3.7.10 MPRA: csv file
Download source: https://mpravardb.rc.ufl.edu/
# |
Column name |
Description |
|---|---|---|
1 |
chr |
chromosome |
2 |
pos |
position of variant |
3 |
ref |
reference allele in the reference genome coordinate of the source cohort |
4 |
alt |
alternative allele in the reference genome coordinate of the source cohort. (This allele is the effect allele.) |
5 |
genome |
reference genome |
6 |
rsid |
rsID identifier |
7 |
disease |
trait/disease |
8 |
cellline |
cell line |
9 |
Description |
description |
10 |
log2FC |
Log2(Fold change) |
11 |
pvalue |
P value |
12 |
fdr |
FDR |
13 |
MPRA_study |
MPRA study |
 1$ head All_MPRA_Data.csv
 2"chr","pos","ref","alt","genome","rsid","disease","cellline","Description","log2FC","pvalue","fdr","MPRA_study"
 3"1",2440958,"A","G","hg38","rs6688934","Schizophrenia","SH-SY5Y","1,049 SZ and 30 AD variants in 64 SZ loci and 9 AD loci, respectively",NA,0.108571634,0.341634497,"A screen of 1049 schizophrenia and 30 Alzheimer's-associated variants for regulatory potential (Myint et al., 2020)"
 4"1",2441515,"A","G","hg38","rs6673661","Schizophrenia","SH-SY5Y","1,049 SZ and 30 AD variants in 64 SZ loci and 9 AD loci, respectively",NA,0.057599896,0.234108669,"A screen of 1049 schizophrenia and 30 Alzheimer's-associated variants for regulatory potential (Myint et al., 2020)"
 5"1",2443319,"A","G","hg38","rs4648844","Schizophrenia","SH-SY5Y","1,049 SZ and 30 AD variants in 64 SZ loci and 9 AD loci, respectively",NA,0.014320564,0.115533569,"A screen of 1049 schizophrenia and 30 Alzheimer's-associated variants for regulatory potential (Myint et al., 2020)"
 6"1",2444405,"T","G","hg38","rs6687012","Schizophrenia","SH-SY5Y","1,049 SZ and 30 AD variants in 64 SZ loci and 9 AD loci, respectively",NA,0.258798019,0.530956548,"A screen of 1049 schizophrenia and 30 Alzheimer's-associated variants for regulatory potential (Myint et al., 2020)"
 7"1",2448266,"A","G","hg38","rs942820","Schizophrenia","SH-SY5Y","1,049 SZ and 30 AD variants in 64 SZ loci and 9 AD loci, respectively",NA,0.077694104,0.275581292,"A screen of 1049 schizophrenia and 30 Alzheimer's-associated variants for regulatory potential (Myint et al., 2020)"
 8"1",2455662,"C","T","hg38","rs4648845","Schizophrenia","SH-SY5Y","1,049 SZ and 30 AD variants in 64 SZ loci and 9 AD loci, respectively",NA,0.453624774,0.700344436,"A screen of 1049 schizophrenia and 30 Alzheimer's-associated variants for regulatory potential (Myint et al., 2020)"
 9"1",8362616,"T","C","hg38","rs2252865","Schizophrenia","SH-SY5Y","1,049 SZ and 30 AD variants in 64 SZ loci and 9 AD loci, respectively",NA,0.551078425,0.775862448,"A screen of 1049 schizophrenia and 30 Alzheimer's-associated variants for regulatory potential (Myint et al., 2020)"
10"1",8363450,"A","G","hg38","rs10779702","Schizophrenia","SH-SY5Y","1,049 SZ and 30 AD variants in 64 SZ loci and 9 AD loci, respectively",NA,0.295545372,0.575535724,"A screen of 1049 schizophrenia and 30 Alzheimer's-associated variants for regulatory potential (Myint et al., 2020)"
11"1",8372076,"C","T","hg38","rs894875","Schizophrenia","SH-SY5Y","1,049 SZ and 30 AD variants in 64 SZ loci and 9 AD loci, respectively",NA,0.543395748,0.774441451,"A screen of 1049 schizophrenia and 30 Alzheimer's-associated variants for regulatory potential (Myint et al., 2020)"